DebuggerDisplay: a well kept secret?
Published 2019-11-17
I want to talk about DebuggerDisplay. This is an attribute that's been around since the early days of .NET Framework and makes debugging a lot easier. It provides the developer with a way to control how the target will be displayed in the debugger window.
Given its usefulness, I find it a bit strange that among all the people I have worked with, none ever seemed to use it, hence the title of this post. At least from now on, I can point them here.
Example
So what does it do exactly? Let's go with the "a picture is worth a thousand words" approach.
Here's a screenshot from a debugging session: I have a list of Flight objects.
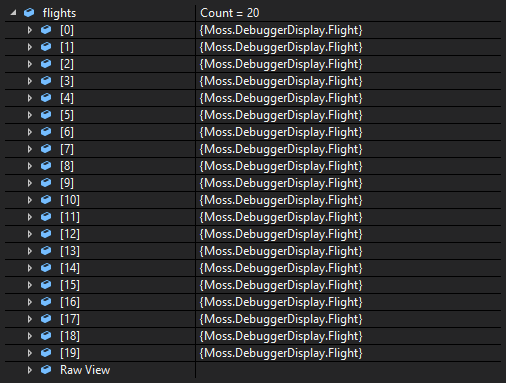
By default, Visual Studio displays a representation of the object by calling ToString(), which returns the type. This isn't terribly useful. If I'm interested in a particular flight, I have to expand each object one by one until I find the one I want.
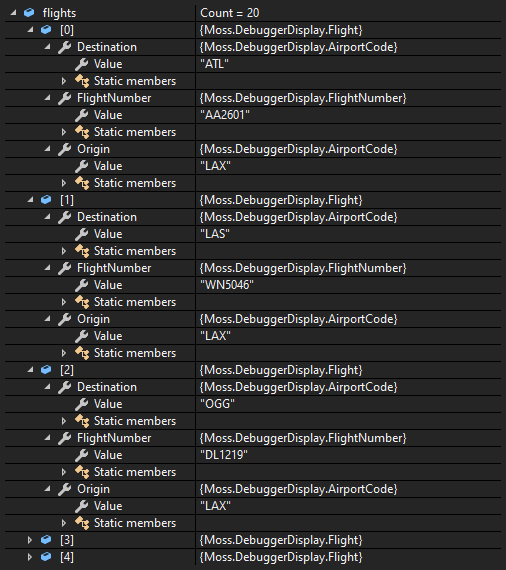
Looks like Flight is made up of strongly typed FlightNumber and AirportCode objects, meaning that I also have to expand those to get to the information I want, which quickly fills the available vertical space and starts looking busy.
What happens if I apply the attribute to FlightNumber and AirportCode types?
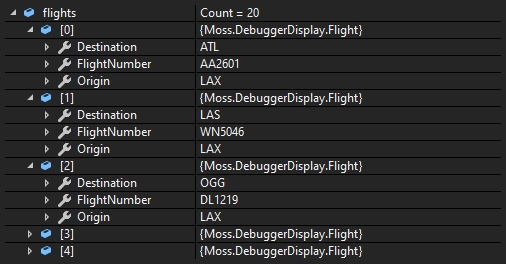
This is better. Now when I expand a flight, I can see the values of its properties without having to further expand those properties.
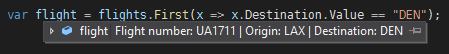
The natural next step is to apply the attribute to the Flight object itself.
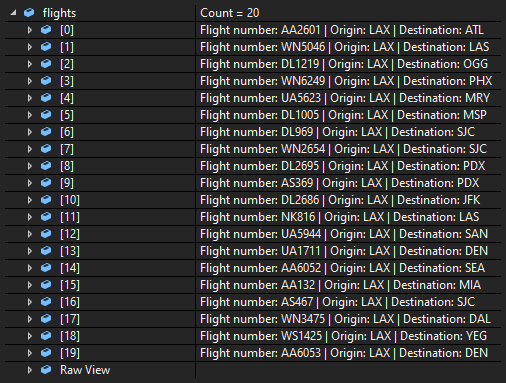
This is great! Now I don't have to expand these objects at all to see the details.
Imagine a scenario where you're handling a type with lots of properties, and a collection made up of not 20 but 50, or 100, or more items. Being able to display a few key bits of information in the debugger provides a much better experience.
Of course, the attribute doesn't just work in the debugger window, but also in the code editor when you hover over objects.
How does this work?
At its most basic, DebuggerDisplay usage is as follows (don't mind the anemic models, they're just here for illustration):
[DebuggerDisplay("{DebuggerDisplayValue,nq}")]
public class Flight
{
    [DebuggerBrowsable(DebuggerBrowsableState.Never)]
    private string DebuggerDisplayValue => $"Flight number: {FlightNumber.Value} | Origin: {Origin.Value} | Destination: {Destination.Value}";

    public FlightNumber FlightNumber { get; set; }
    public AirportCode Origin { get; set; }
    public AirportCode Destination { get; set; }
}
The attribute is applied to the target that you want to be displayed in a customised way. Here I've applied it to a class. You specify the name of the property whose value will be used for display purposes. I prefer "DebuggerDisplayValue" but you can use whatever name you want. The added "nq" stands for "no quotes", which gets rid of the string quotes when the result is displayed.
As I don't want DebuggerDisplayValue property itself to be visible, I can apply DebuggerBrowsable attribute to hide it.
See Jared Parson's post on the specifics of the value passed in to the attribute constructor. You can also see the different available targets on MSDN.
Taking it further
I don't want these attributes or the added property polluting Release builds, so I add a preprocessor directive to make sure they are not baked into the assemblies for Release builds. The downside is that this makes the class look a bit busy. I used to not mind it but I've recently started experimenting with converting the class to a partial one and putting DebuggerDisplay related stuff in a separate file.
public partial class Flight
{
    public FlightNumber FlightNumber { get; set; }
    public AirportCode Origin { get; set; }
    public AirportCode Destination { get; set; }
}#if DEBUG
[DebuggerDisplay("{DebuggerDisplayValue,nq}")]
public partial class Flight
{
[DebuggerBrowsable(DebuggerBrowsableState.Never)]
private string DebuggerDisplayValue => $"Flight number: {FlightNumber.Value} | Origin: {Origin.Value} | Destination: {Destination.Value}";
}
#endifThis looks like a promising approach so I'll keep using it for a while. I might write a Roslyn code refactoring extension to do all of this for me.
Alternatives
Overriding ToString() would give the same result for the purposes of debugging. However, ToString() is there to provide a textual representation for general use whereas I'm only interested in the specific use case of debugging. These are different concerns and I don't want ToString() to be burdened with both.
The other alternative is to use DebuggerTypeProxy but I've never explored that option as it seems to need too much boilerplate code compared to the partial class approach.
Making things easy
I have created a snippet for the atttibute and another snippet for the property it uses. You can import them using the Code Snippets Manager.